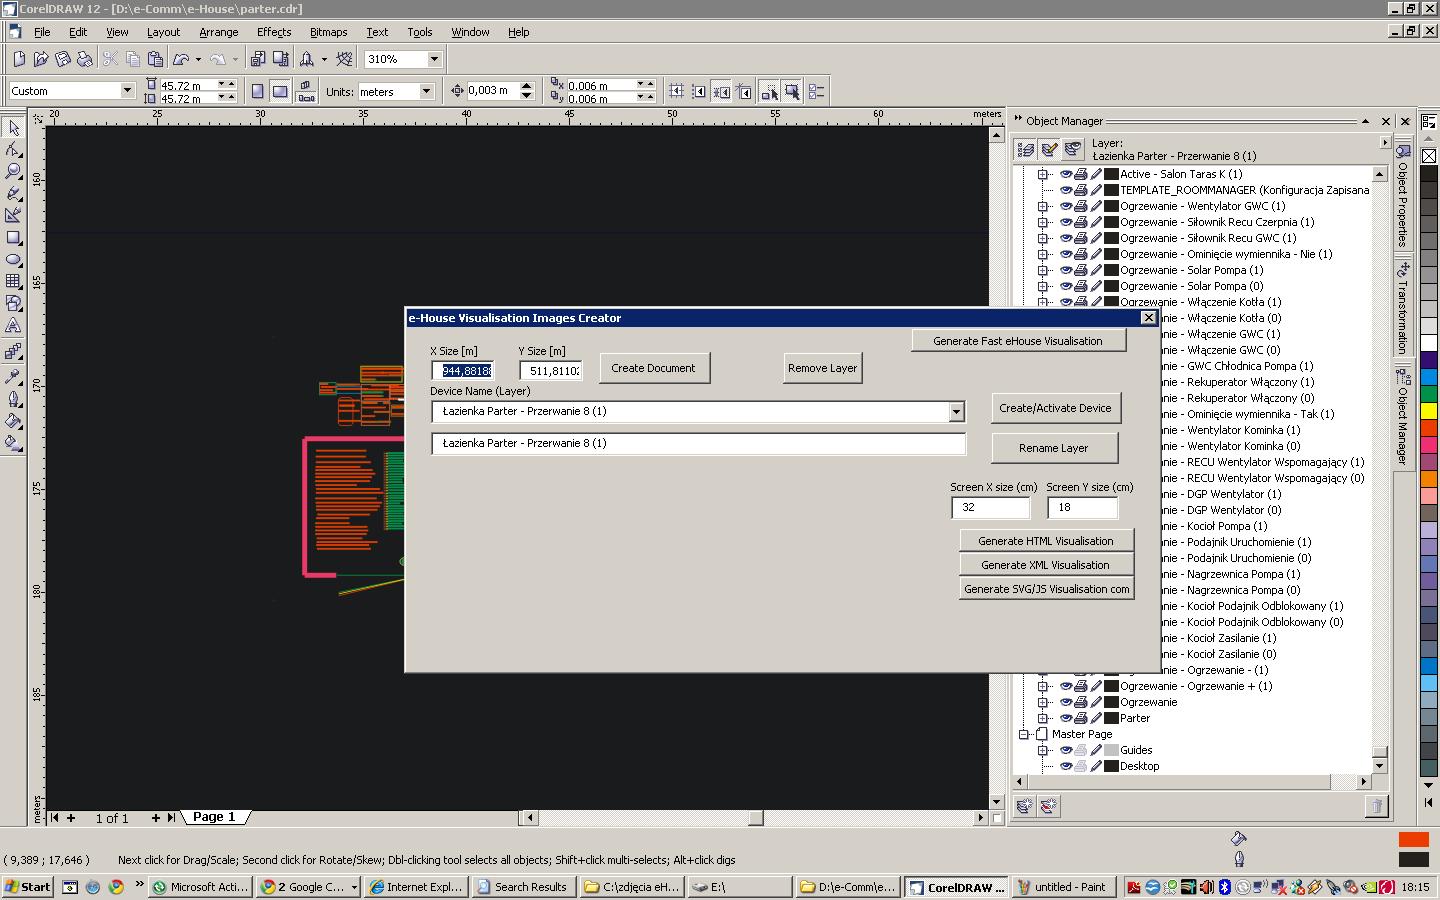
eHouse-visualisatie Creatof - drawing views based on individual design of template.
eHouse Visualization Creator / Editor (schaalbare vectorafbeeldingen)
eHouse Visualization Creator / Editor is VBA (Visual Basic for Applications) voor Corel Draw waarmee:- namen importeren uit eHouse-configuratietoepassingen
- SVG-objecten tekenen: handmatig, script ondersteund, gebaseerd op individuele sjabloon
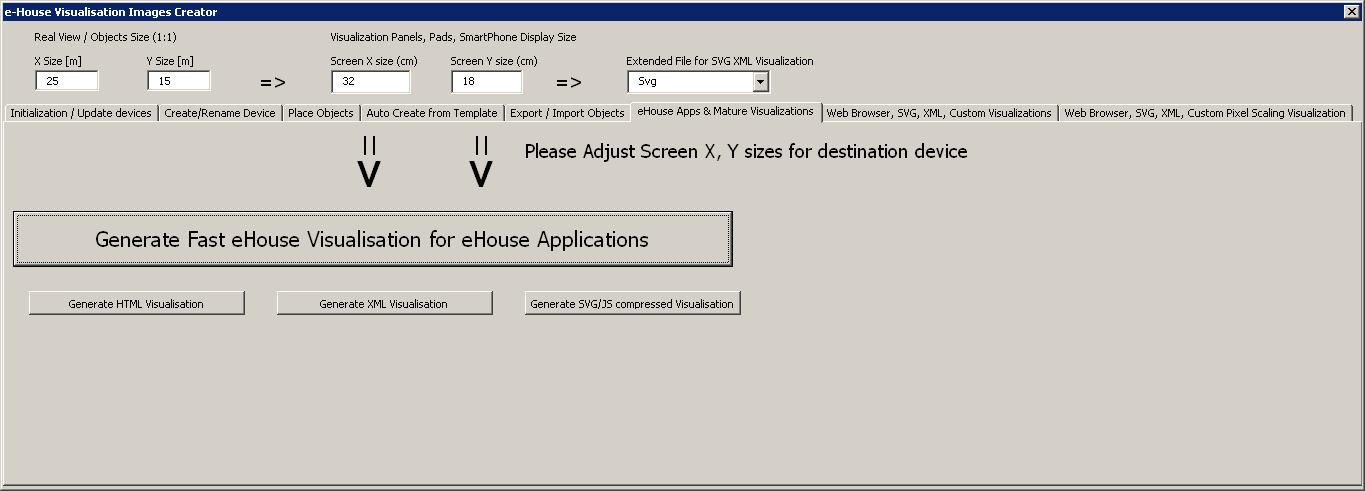
- Creating "Active Views" for graphic control for web browsers, and eHouse Visualization applications for Android, Java, Windows,.Net/.Net CF, etc
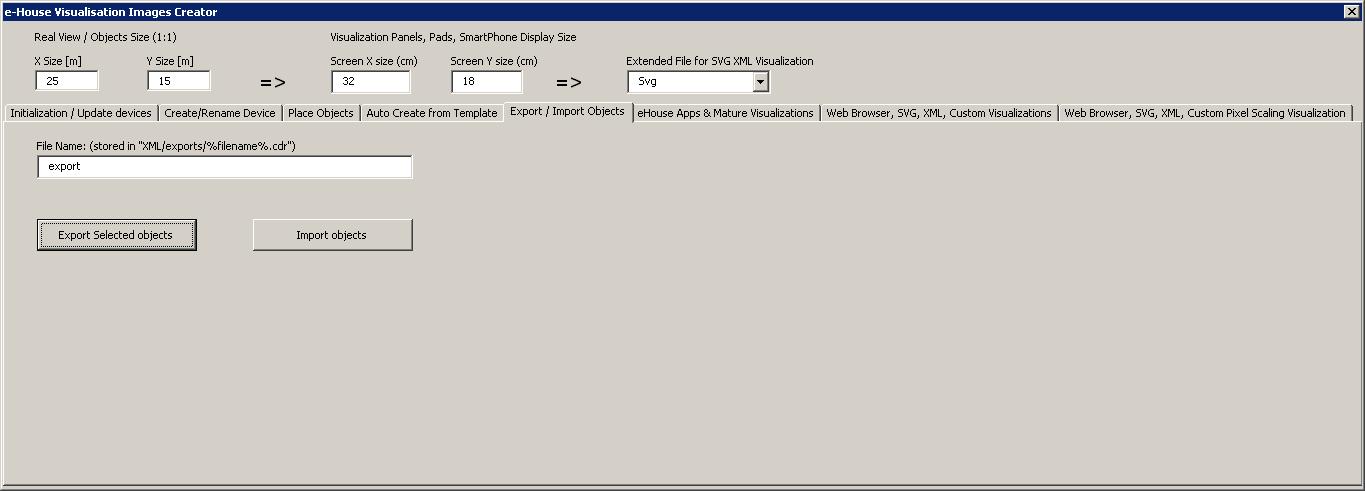
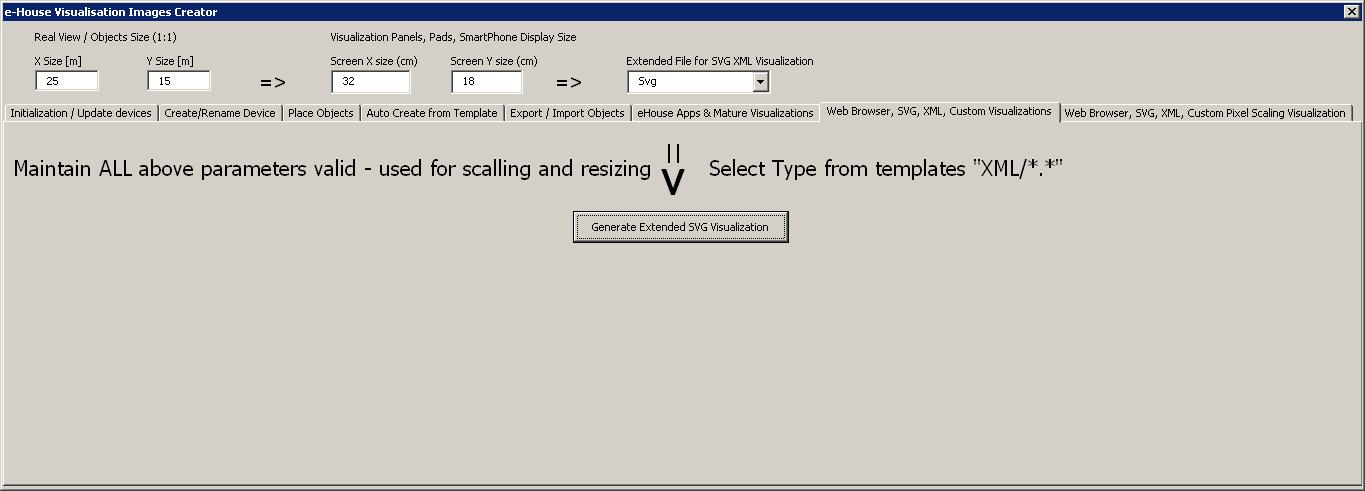
- Visualisaties exporteren voor: native eHouse-applicaties, webbrowserpagina's, aangepaste visualisaties (op basis van sjabloon) - in tekstformaat
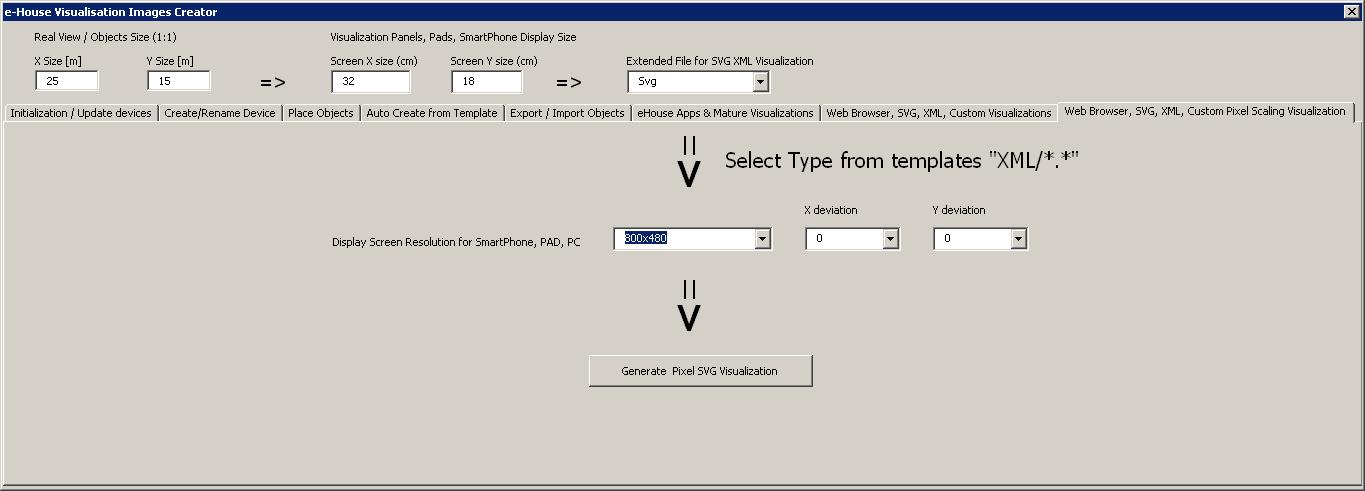
- Exporteren maakt eenvoudige aanpassing van schermformaten / resolutie mogelijk
Deze oplossing vereist Corel Draw Applicatie met VBA-ondersteuning (niet beschikbaar op sommige beperkte versies: Home / Student). However, creating of visualization is rather one-time operation, and you can use Evaluation/Trial Full version of Corel Draw to create visualization.
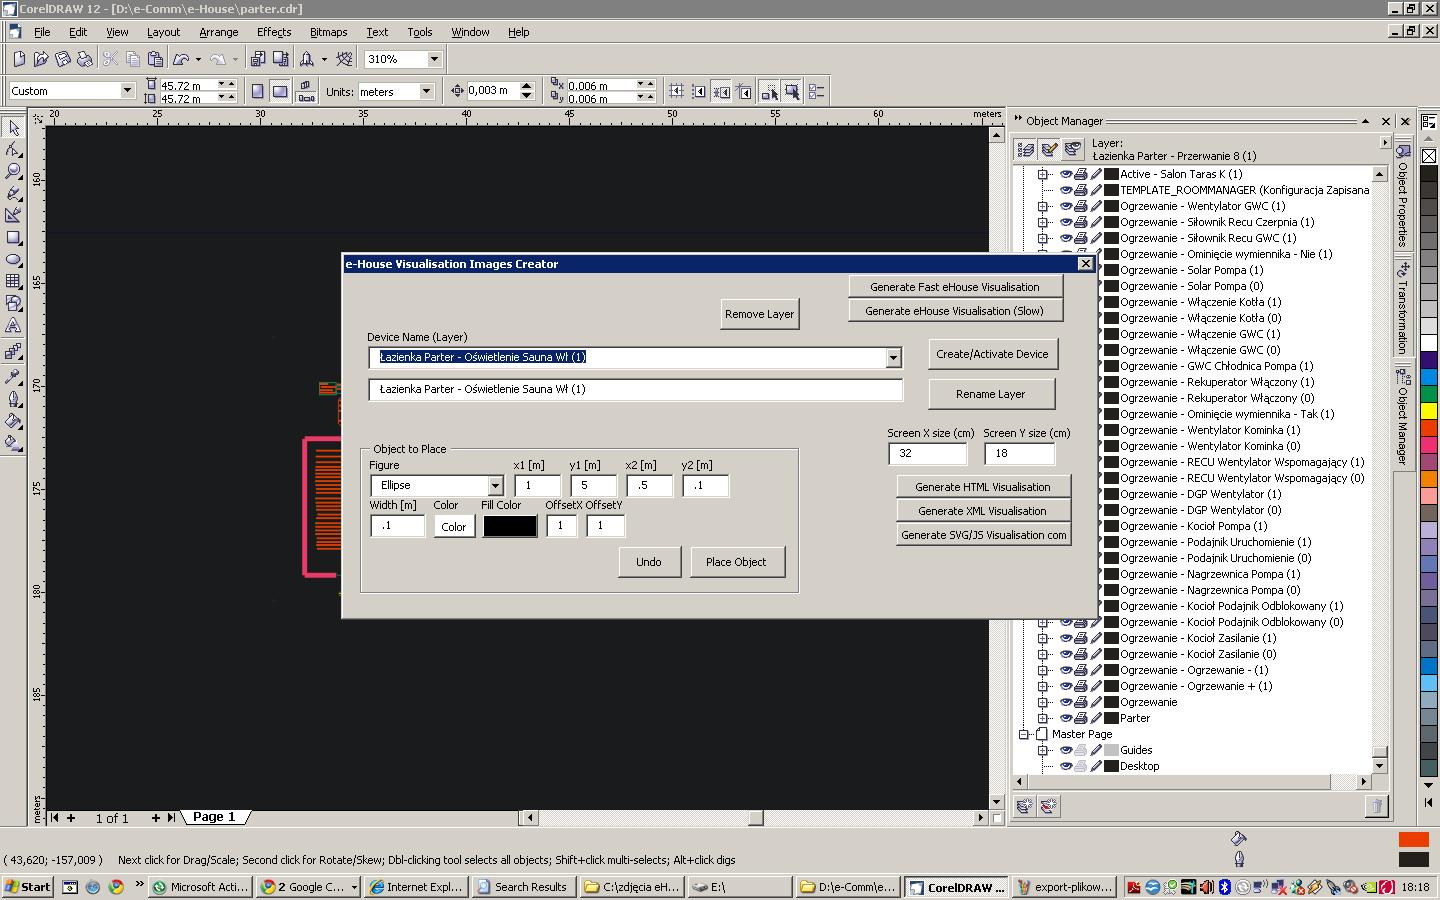
An example of eHouse Visualization view created for an individual project in the Corel Draw application using SVG (scalable vector graphics).
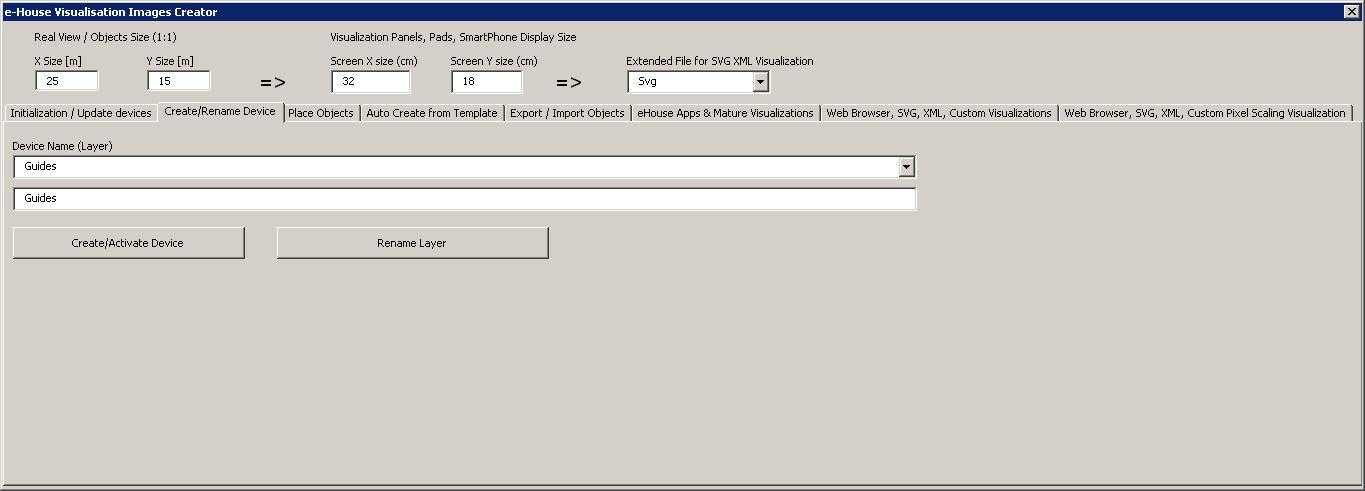
Each eHouse "Active object" (voor elke status van het signaaltype: aan / uit, hoog / laag / ok) wordt aangemaakt op een enkele "Active" layer of the Corel Draw application
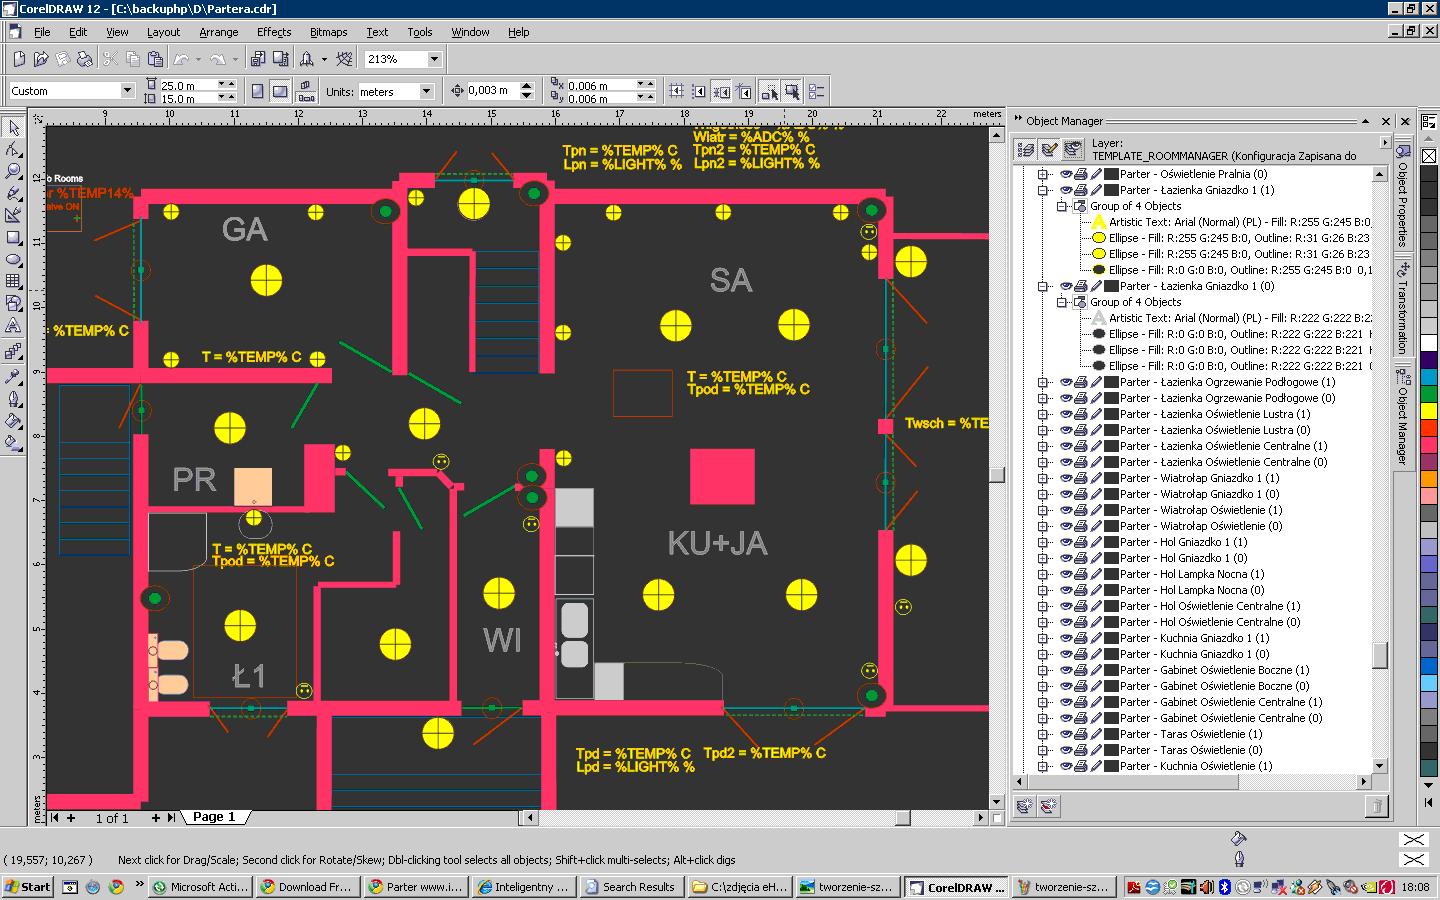
The view is created in 1:1 scale (entered X/Y initial size is in meters.
After initialization of empty "Active Form", walls/lines and other simple objects may be imported to the form in 1:1 scale to neutral layer.
Voor de meeste flexibiliteit van grafische bediening en visualisatie Weergaven (kleine SmartPhone-schermen, slecht zicht buiten, kleine aanraakpanelen), raden we ten zeerste aan om onnodige objecten op de weergave te minimaliseren om volledige functionaliteit te bereiken op 5 inch SmartPhones (zonder zoomen en scrollen).
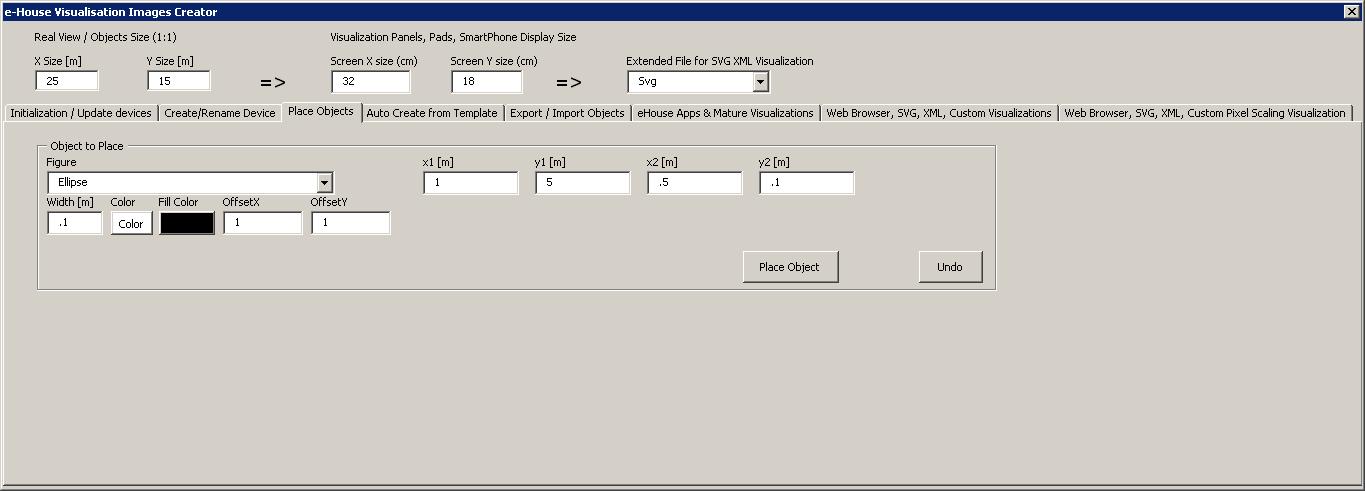
Visualization allows you to create simple "Active" figuren en objecten die zorgen voor een hoge compatibiliteit van weergave voor verschillende eHouse-visualisatiestandaarden:
- rechthoek / vierkant met mogelijkheid tot afronding
- cirkel
- veelhoek
- pad
- Ovaal
- tekst
- lijn
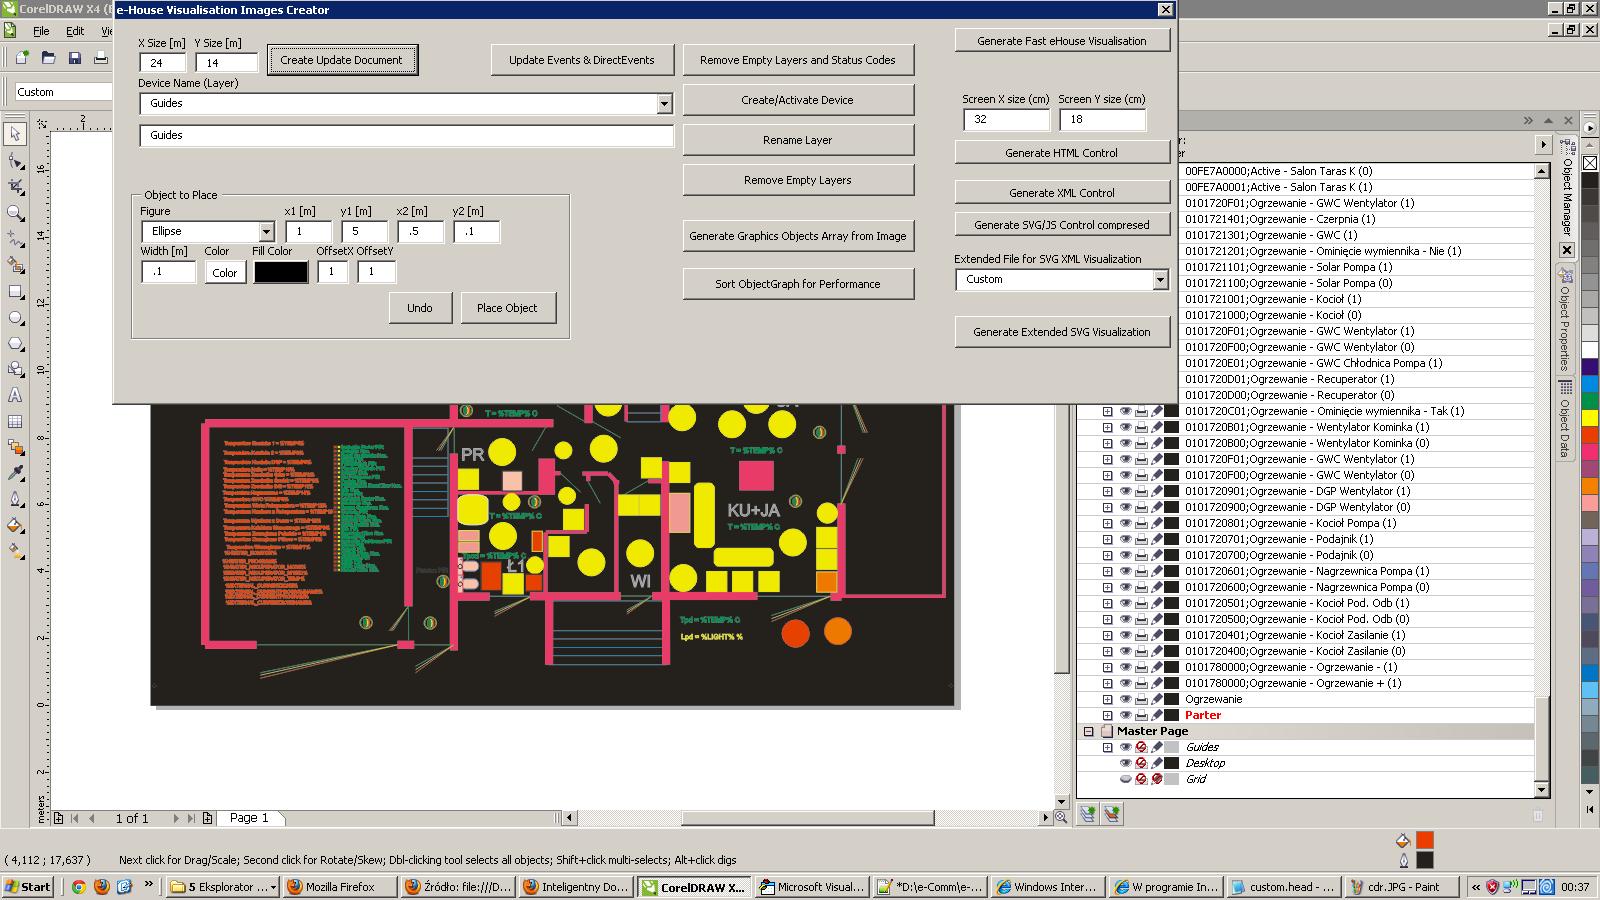
When precision positioning is required, macro supports placing direct objects at the required coordinates.
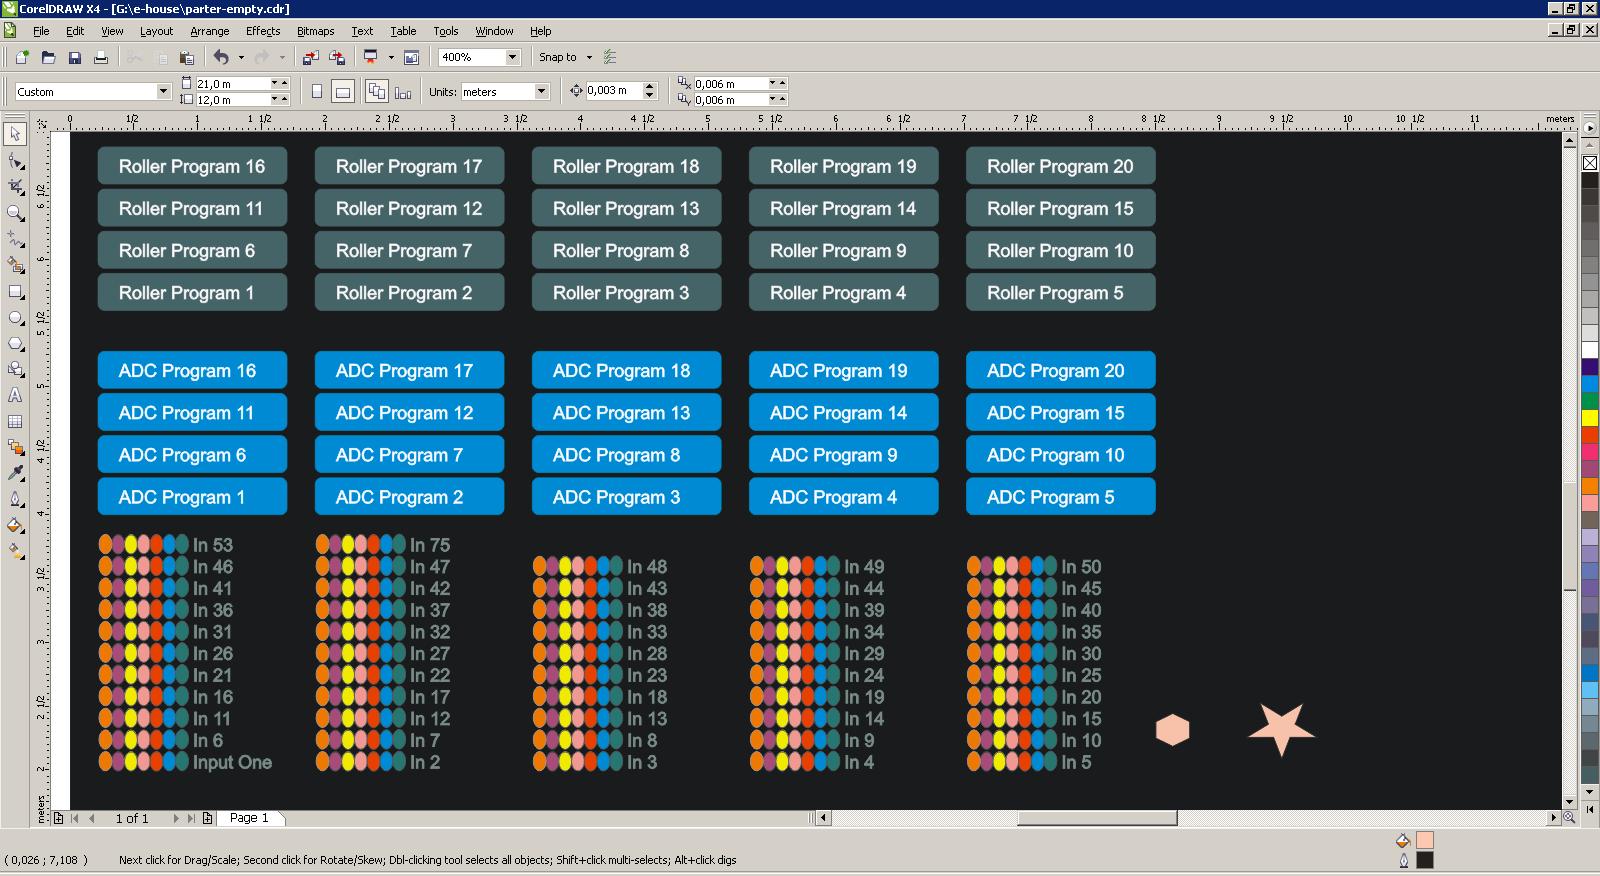
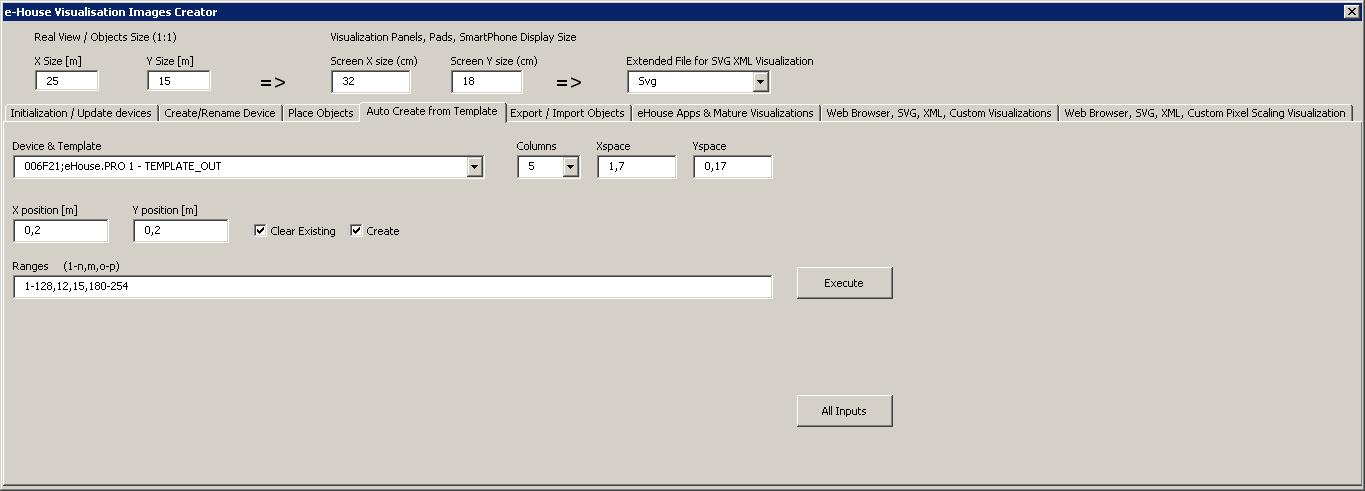
Geautomatiseerde visualisatie maken op basis van sjablonen
Automatic placement of "Active objects" op visualisatie canvas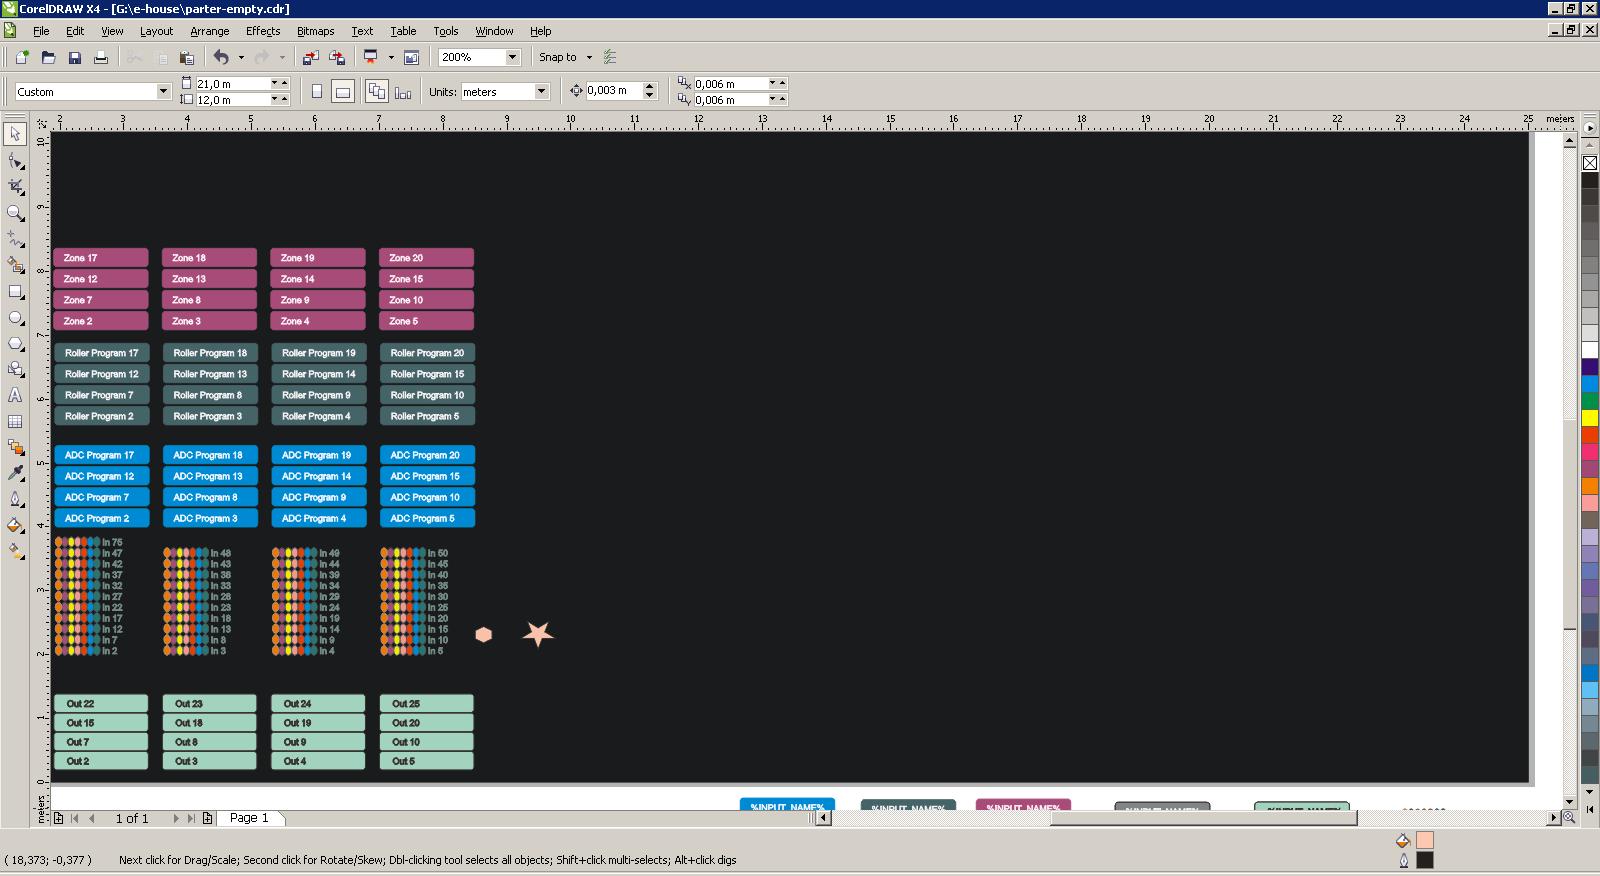
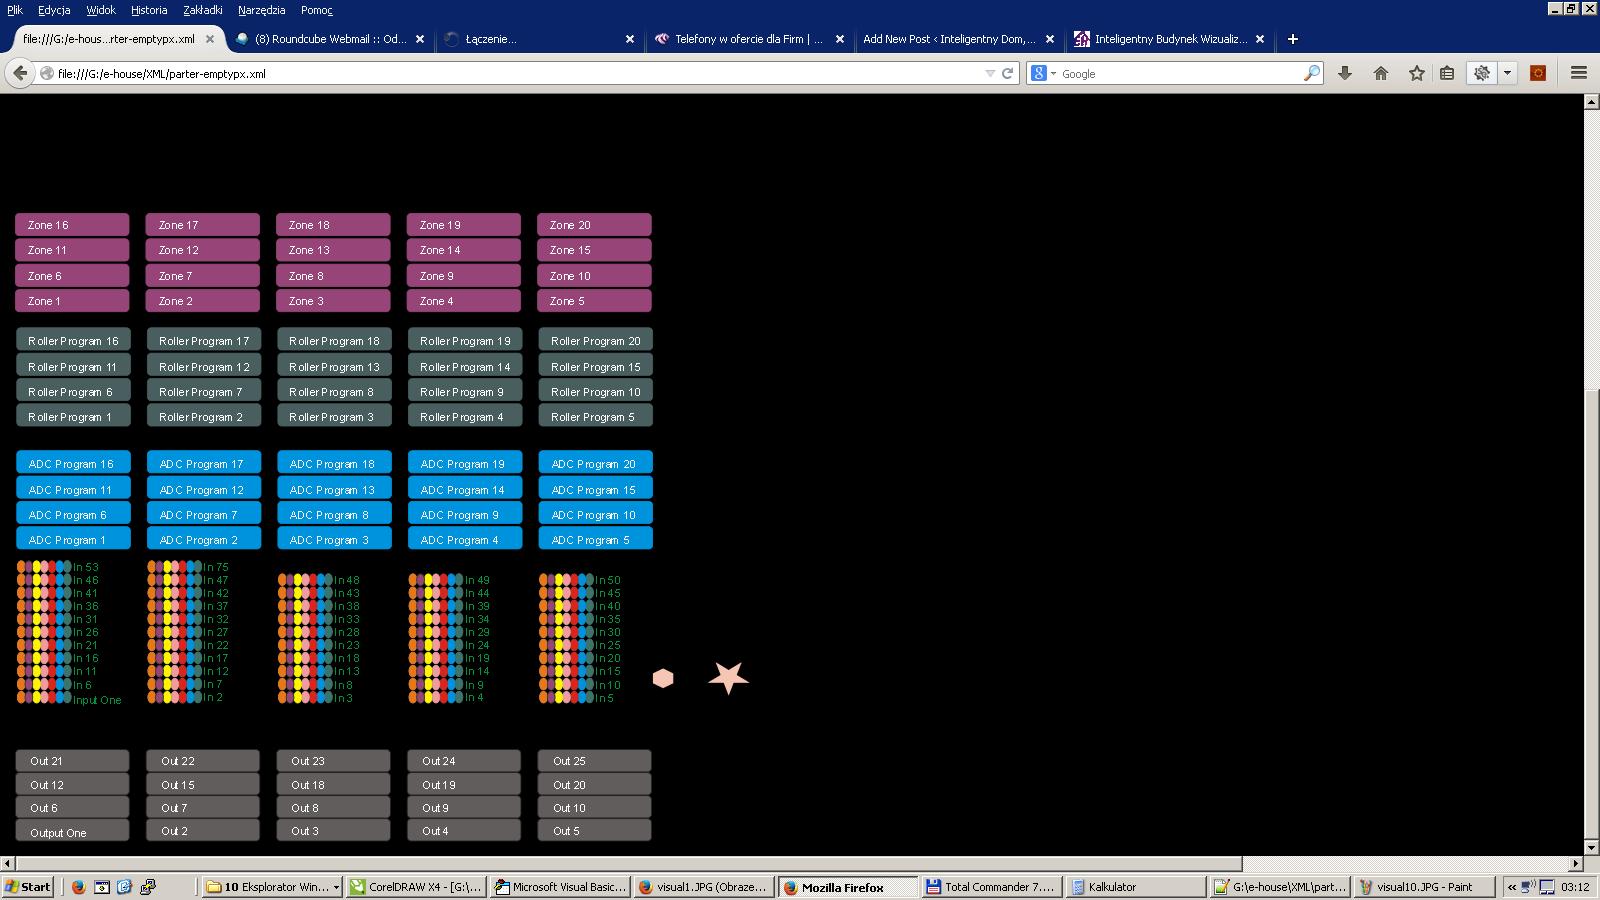
Weergeven in een webbrowser (elke ondersteunende SVG)
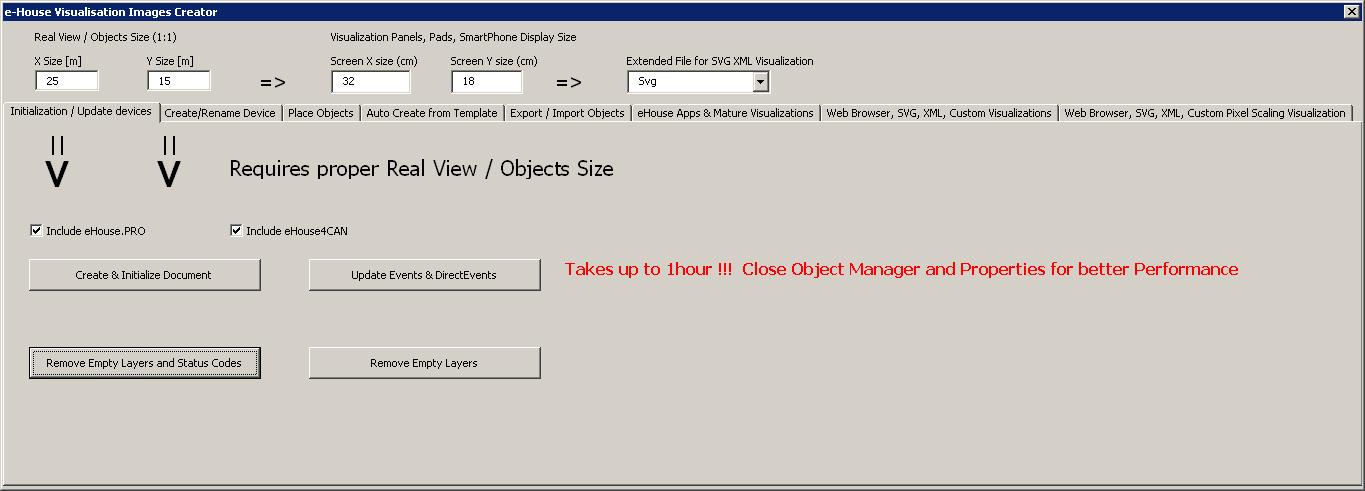
Initialization of visualization and loading of data from the eHouse configuration.
Exporteer visualisatiegegevens voor webbrowsers, eHouse-visualisatietoepassingen
Een volledige beschrijving van het maken van een visualisatie is te vinden op:
eHouse Building Automation Visualization Creator | PL